Generate and Plot Forecasts for Time Series Data
Includes:SMA, WMA and Single and Double Exponential Smoothing
pip install time-series-model-basics
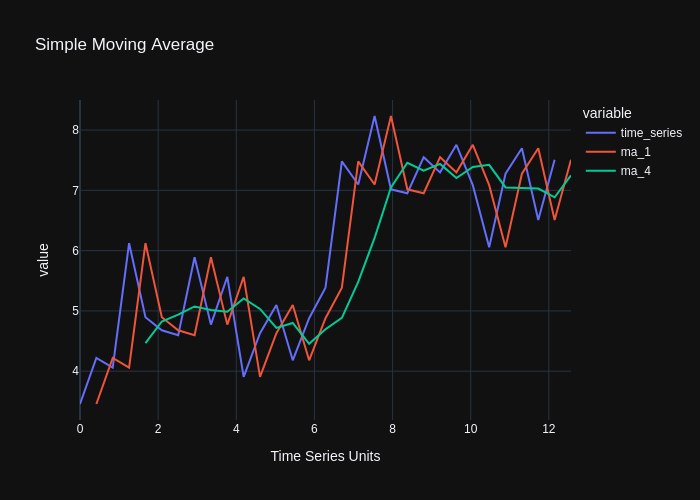
Plot a Simulated Time Series with two or any number of Simple Moving Averages as follows:
from time_series_model_basics.moving_average import SMA

df, fig = SMA(1, 4)

fig.write_image("images/sma.png")
When running on a notebook you may alternatively use
fig.show()
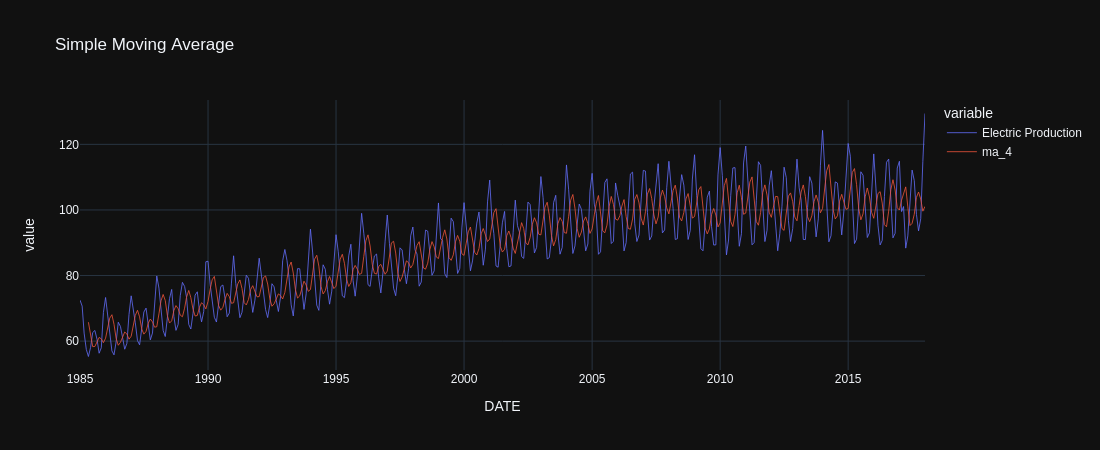
Forecast with dataframe as follows:
import pandas as pd

df = pd.read_csv(
    '../data/Electric_Production.csv',
    index_col='DATE',
    parse_dates=['DATE'],
)
ts_col = 'Electric Production'
df.columns = [ts_col]
_, fig = SMA(
    4,
    df=df,
    ts_col=ts_col,
)
fig.update_layout(
    autosize=False,
    width=1100,
    height=450,
)
fig.update_traces(line=dict(width=0.8))
fig.write_image("images/elec_prod_sma.png",)
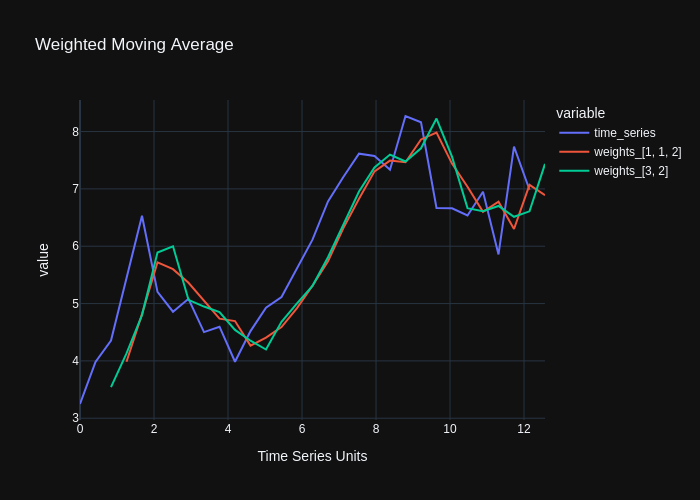
For the case of Weighted Moving Averages, pass the weights as lists:
from time_series_model_basics.moving_average import WMA

df,fig = WMA([1,1,2],[3,2])

fig.write_image("images/wma.png")
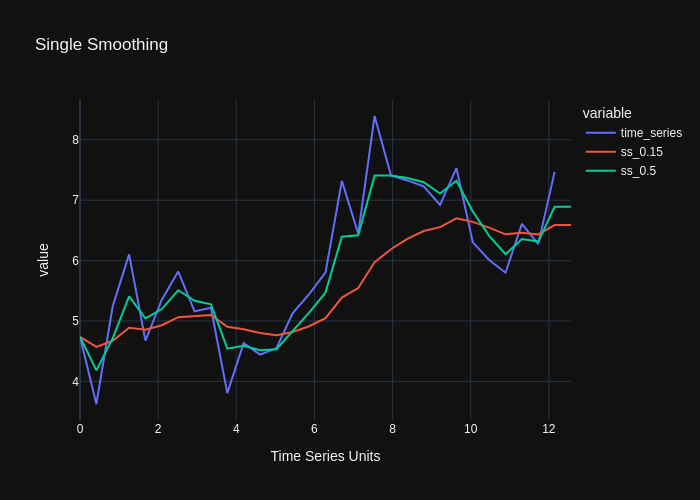
Plot a Simulated Time Series with two or any number of simple exponential smoothing as follows:
from time_series_model_basics.smoothing import SINGLE

df, fig = SINGLE(.15, .5)
fig.write_image("images/single.png",)
from time_series_model_basics.smoothing import DOUBLE

df, fig = DOUBLE(
    [.25, .3],
    [.5, .6],
)
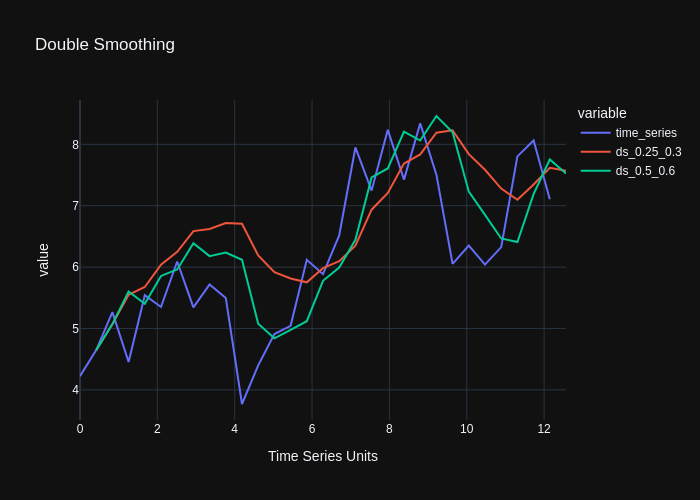
fig.write_image("images/double.png")
